


Context
Groundwater is the water present beneath the Earth's surface in rock and soil pore spaces and in the fractures of rock formations. About 30 percent of all readily available freshwater in the world is groundwater. A unit of rock or an unconsolidated deposit is called an aquifer when it can yield a usable quantity of water. The depth at which soil pore spaces or fractures and voids in rock become completely saturated with water is called the water table. Groundwater is recharged from the surface; it may discharge from the surface naturally at springs and seeps and can form oases or wetlands. Groundwater is also often withdrawn for agricultural, municipal, and industrial use by constructing and operating extraction wells. Additionally, given the growing scarcity and strong demand for water resources, the sustainability of water resource management requires an urgent policy of measures to ensure the rational use of these resources. The heterogeneous properties of groundwater systems are related to the dynamic temporal-spatial patterns that cause great difficulty in quantifying their complex processes, while good regional groundwater level forecasts are completely required for managing water resources to guarantee suitable support of water demands within any area. Water managers and farmers need intelligent groundwater and irrigation planning systems and effective mechanisms to benefit from the scientific and technological revolution, particularly artificial intelligence engines, to enhance water support in their water use planning practices. Furthermore, California has complex water management systems with natural features like mountain snowpack, lakes, rivers, and groundwater basins that are managed with engineered features like reservoirs, levees/flood walls, weirs, culverts, bypasses, and canals. Models represent the complex physical interactions between these features in a conceptual way. Models and other analytical tools help water managers make informed decisions about how best to manage water for people, farms, and the environment as well as to protect lives and properties from flooding. 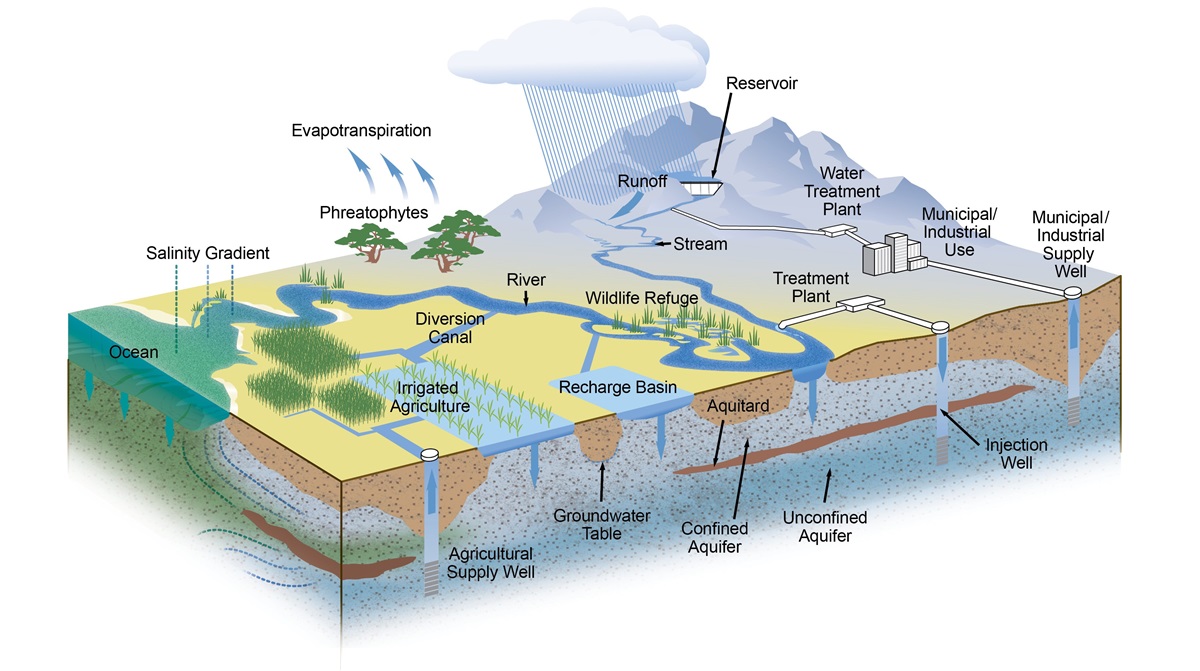 DWR continuous groundwater level measurements contain continuous time-series data from automated recorders at sites operated by the Department of Water Resources. Readings are taken at 15-minute to one-hour intervals. Some of the readings are relayed to the California Data Exchange Center. However, most of the monitoring sites are visited once every month or two, when readings are off-loaded from data recorders, then finalized and published. Wells monitored for this dataset are located within Butte, Colusa, Glenn, Mendocino, Modoc, Sacramento, San Joaquin, Shasta, Siskiyou, Solano, Sutter, Tehama, Yolo, and Yuba Counties. Water-level measurements are the principal source of information about changes in groundwater storage and movement in a basin, and how these are affected by various forms of recharge (e.g., precipitation, seepage from streams, irrigation return) and discharge (e.g., seepage to streams, groundwater pumping). Water-level monitoring involves "continuous" or periodic measurements. Continuous monitoring makes use of automatic water-level sensing and recording instruments that are programmed to make scheduled measurements in wells. This provides a high-resolution record of water-level fluctuations. Resulting hydrographs can accurately identify the effects of various stresses on the aquifer system and provide measurements of maximum and minimum water levels in aquifers. Continuous monitoring may be the best technique to use for monitoring fluctuations in groundwater levels during droughts and other critical periods when hydraulic stresses may change at relatively rapid rates, or when real-time data are needed for making water management decisions see USGS reference. This dataset contains (1,048,576) records and includes about 12 variables necessary for the groundwater level estimation as shown in the table below:
  This dataset contains groundwater levels in daily and monthly mean versions. Daily version: The data was collected from 3/25/1992 to 12/27/2022. Monthly version: The data was collected from 12/1/1969 to 12/1/2022.
Acknowledgments
Data source: California Department of Water Resources Website: water.ca.gov
看了又看
验证报告
以下为卖家选择提供的数据验证报告:

Continuous Groundwater Level Measurements | -2023
16.61MB
申请报告


