


klib library enables us to quickly visualize missing data, perform data cleaning, visualize data distribution plot, visualize correlation plot and visualize categorical column values. klib is a Python library for importing, cleaning, analyzing and preprocessing data. Explanations on key functionalities can be found on Medium / TowardsDataScience in the examples section or on YouTube (Data Professor).
Original Github repo
Usage
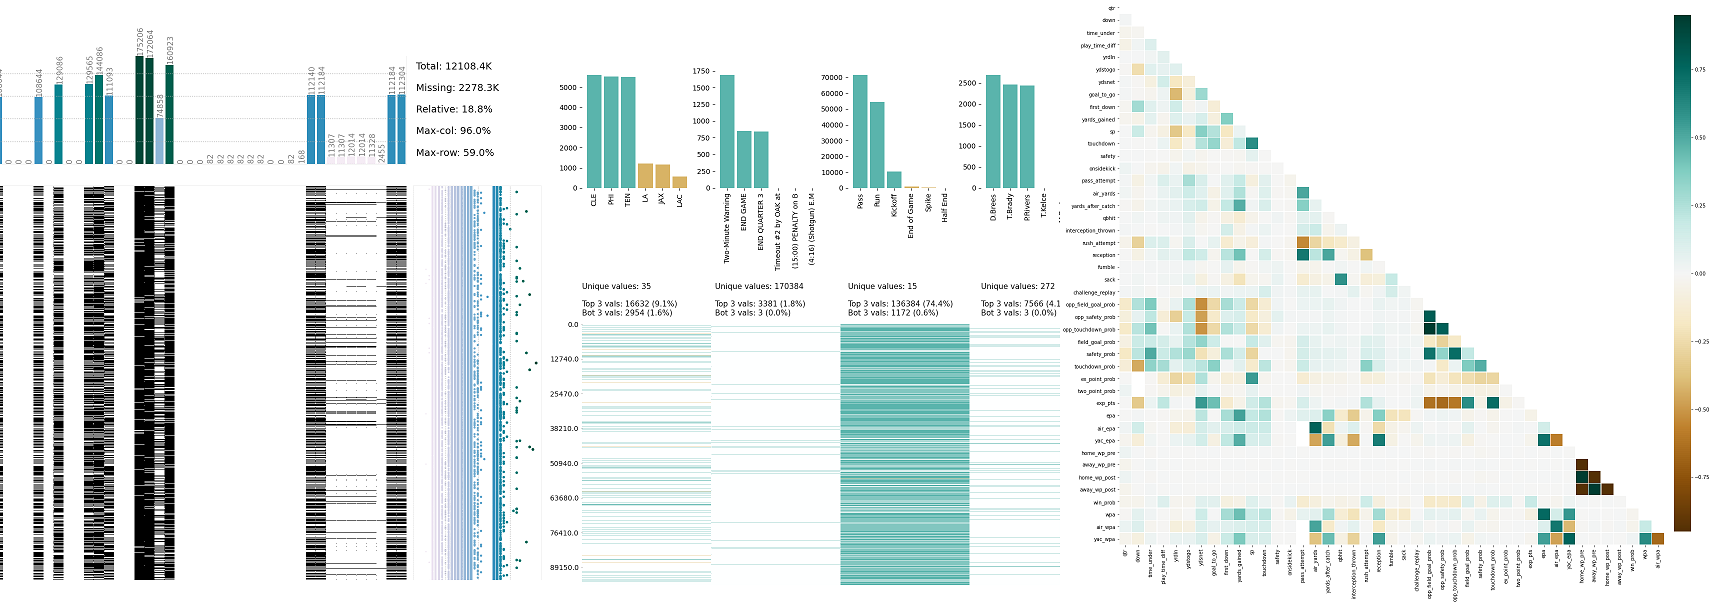
!pip install klib import klib import pandas as pd df = pd.DataFrame(data) # klib.describe functions for visualizing datasets - klib.cat_plot(df) # returns a visualization of the number and frequency of categorical features - klib.corr_mat(df) # returns a color-encoded correlation matrix - klib.corr_plot(df) # returns a color-encoded heatmap, ideal for correlations - klib.dist_plot(df) # returns a distribution plot for every numeric feature - klib.missingval_plot(df) # returns a figure containing information about missing values Examples
Take a look at this starter notebook.
Further examples, as well as applications of the functions can be found here.
Contributing
Pull requests and ideas, especially for further functions are welcome. For major changes or feedback, please open an issue first to discuss what you would like to change. Take a look at this Github repo.
License
看了又看
验证报告
以下为卖家选择提供的数据验证报告:

Klib library python
85.73MB
申请报告


